Plot filled contours.
| Parameters: |
|
|---|---|
| Returns: | (VectoryLayer) Contour filled VectoryLayer created from array data. |
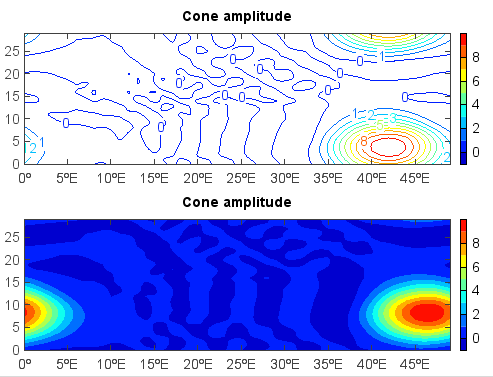
Example:
f = addfile('D:/Temp/nc/cone.nc')
u = f['u'][4,:,:]
subplot(2,1,1)
layer = contour(u)
clabel(layer)
title('Cone amplitude')
colorbar(layer)

subplot(2,1,2)
u = f['u'][5,:,:]
layer = contourf(u)
title('Cone amplitude')
colorbar(layer)