Plot filled contours.
| Parameters: |
|
|---|---|
| Returns: | (VectoryLayer) Contour filled VectoryLayer created from array data. |
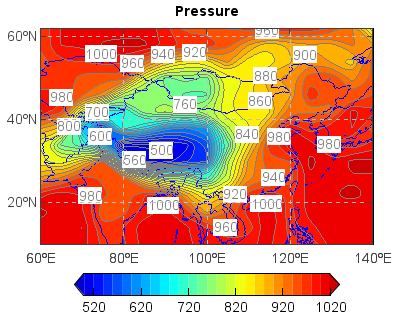
Example:
f = addfile('D:/Temp/GrADS/model.ctl')
psv = f['PS']
ps = psv[0,'10:60','60:140']
axesm()
mlayer = shaperead('D:/Temp/map/country1.shp')
geoshow(mlayer, edgecolor=(0,0,255))
layer = contourfm(ps, 20)
cl = contourm(ps, 20, colors='gray')
clabel(cl)
title('Pressure')
yticks(arange(20, 61, 20))
grid()
colorbar(layer, orientation='horizontal', extendrect=False, shrink=0.8, aspect=12)