axis
xlim
Enter search terms or a module, class or function name.
Turn the aexs grids on or off.
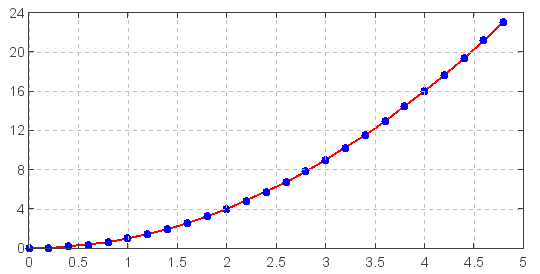
Example:
x = arange(0., 5., 0.2)
y = x**2
plot(x, y, label='Series_1', linewidth=2.0)
plot(x, y, 'bo')
grid()