linregress
- numeric.stats.linregress(x, y)
Calculate a linear least-squares regression for two sets of measurements.
- Parameters:
y (x,) – (array_like) Two sets of measurements. Both arrays should have the same length.
- Returns:
Result slope, intercept, relative coefficient, two-sided p-value for a hypothesis test whose null hypothesis is that the slope is zero, standard error of the estimated gradient, validate data number (remove NaN values).
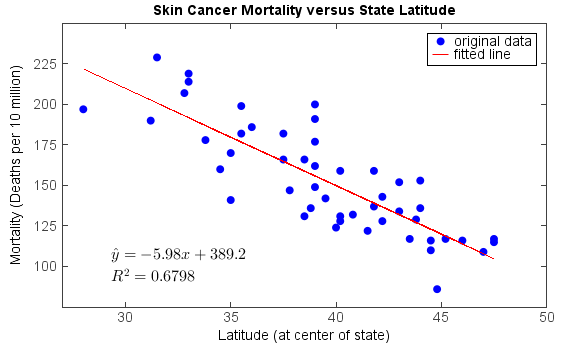
Examples:
fn = 'D:/Temp/ascii/skincancer.txt'
table = readtable(fn, format='%s%f%2i%f')
lat = table['Lat']
mort = table['Mort']

slope, intercept, r_value, p_value, std_err = stats.linregress(lat, mort)
scatter(lat, mort, label='original data', edge=False)
plot(lat, intercept + slope*lat, 'r', label='fitted line')
text(29, 100, r'$\hat{y} = ' + '%.2f' % slope + 'x + ' + \
    '%.1f' % intercept + '$', fontsize=16)
text(29, 88, r'$R^2 = '+ '%.4f' % (r_value**2) + '$', fontsize=16)
legend()
xlim(27, 50)
ylim(75, 250)
xticks(arange(30, 51, 5))
yticks(arange(100, 226, 25))
title('Skin Cancer Mortality versus State Latitude')
xlabel('Latitude (at center of state)')
ylabel('Mortality (Deaths per 10 million)')