contourm
- mipylib.plotlib.miplot.contourm(*args, **kwargs)
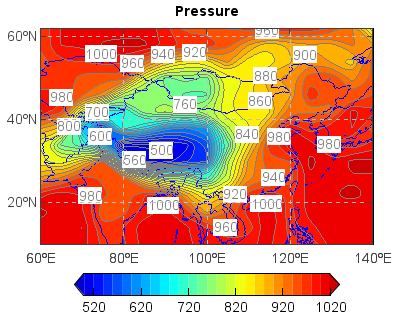
Plot contours on the map.
- Parameters:
x – (array_like) Optional. X coordinate array.
y – (array_like) Optional. Y coordinate array.
z – (array_like) 2-D z value array.
levs – (array_like) Optional. A list of floating point numbers indicating the level curves to draw, in increasing order.
cmap – (string) Color map string.
colors – (list) If None (default), the colormap specified by cmap will be used. If a string, like ‘r’ or ‘red’, all levels will be plotted in this color. If a tuple of matplotlib color args (string, float, rgb, etc), different levels will be plotted in different colors in the order specified.
fill_value – (float) Fill_value. Default is
-9999.0.proj – (ProjectionInfo) Map projection of the data. Default is None.
order – (int) Z-order of created layer for display.
- Returns:
(VectoryLayer) Contour VectoryLayer created from array data.
Example:
f = addfile('D:/Temp/GrADS/model.ctl')
psv = f['PS']
ps = psv[0,'10:60','60:140']
axesm()
mlayer = shaperead('D:/Temp/map/country1.shp')
geoshow(mlayer, edgecolor=(0,0,255))
layer = contourfm(ps, 20)
cl = contourm(ps, 20, colors='gray')
clabel(cl)
title('Pressure')
yticks(arange(20, 61, 20))
grid()
colorbar(layer, orientation='horizontal', extendrect=False, shrink=0.8, aspect=12)