subplot
- mipylib.plotlib.miplot.subplot(nrows, ncols, plot_number)
Returen a subplot axes positioned by the given grid definition.
- Parameters:
nrows (nrows,) – (int) Whree nrows and ncols are used to notionally spli the figure into
nrows * ncolssub-axes.plot_number – (int) Is used to identify the particular subplot that this function is to create within the notional gird. It starts at 1, increments across rows first and has a maximum of
nrows * ncols.
- Returns:
Current axes specified by
plot_number.
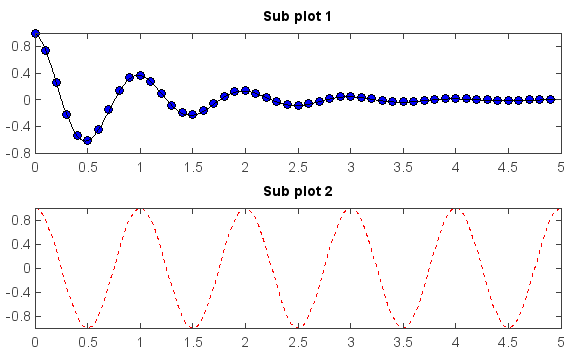
Example:
def f(t):
    return exp(-t) * cos(2*pi*t)

t1 = arange(0., 5., 0.1)
t2 = arange(0., 5., 0.02)

subplot(2,1,1)
plot(t1, f(t1), 'bo', t2, f(t2), 'k')
title('Sub plot 1')

subplot(2,1,2)
plot(t2, cos(2*pi*t2), 'r--')
title('Sub plot 2')