surf
- mipylib.plotlib.miplot.surf(ax)
creates a three-dimensional surface plot
- Parameters:
x – (array_like) Optional. X coordinate array.
y – (array_like) Optional. Y coordinate array.
z – (array_like) 2-D z value array.
c – (array_like) Optional. Additionally specifies the surface color.
cmap – (string) Color map string.
lighting – (bool) Using light or not.
- Returns:
3D surface graphic
Examples:
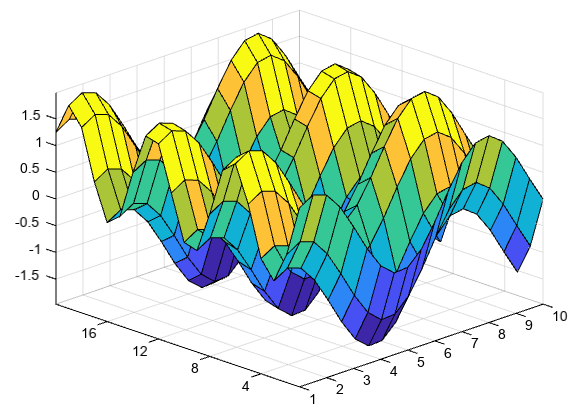
Create three matrices of the same size. Then plot them as a surface. The surface plot uses Z for both height and color.
[X,Y] = meshgrid(arange(1,10.5,0.5), arange(1,20.1))
Z = sin(X) + cos(Y)
surf(X, Y, Z)
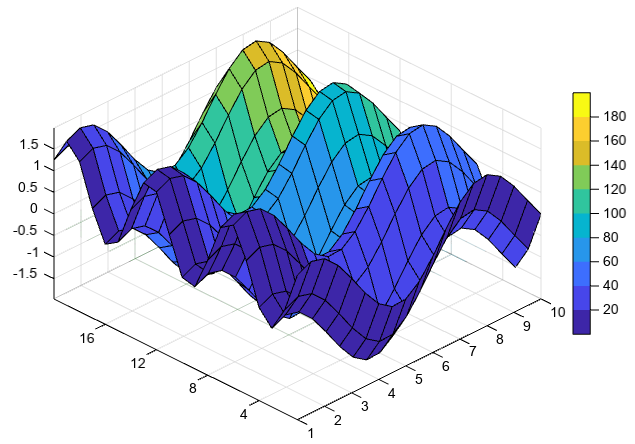
Specify the colors for a surface plot by including a fourth matrix input, C. The surface plot uses Z for height and C for color. Specify the colors using a colormap, which uses single numbers to stand for colors on a spectrum. When you use a colormap, C is the same size as Z. Add a color bar to the graph to show how the data values in C correspond to the colors in the colormap.
[X,Y] = meshgrid(arange(1,10.5,0.5), arange(1,20.1))
Z = sin(X) + cos(Y)
C = X * Y
surf(X, Y, Z, C)
colorbar()
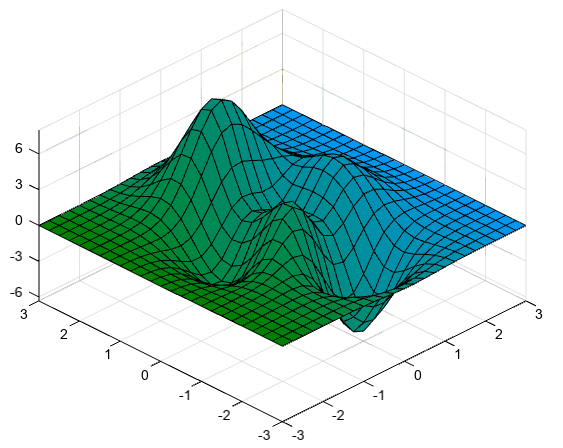
Specify the colors for a surface plot by including a fourth matrix input, CO. The surface plot uses Z for height and CO for color. Specify the colors using truecolor, which uses triplets of numbers to stand for all possible colors. When you use truecolor, if Z is m-by-n, then CO is m-by-n-by-3. The first page of the array indicates the red component for each color, the second page indicates the green component, and the third page indicates the blue component.
[X,Y,Z] = peaks(25)
ny, nx = Z.shape
CO = zeros([ny, nx, 3])
CO[:,:,0] = zeros(25) # red
CO[:,:,1] = ones(25)*linspace(0.5,0.6,25) # green
CO[:,:,2] = ones(25)*linspace(0,1,25) # blue
surf(X,Y,Z,CO)
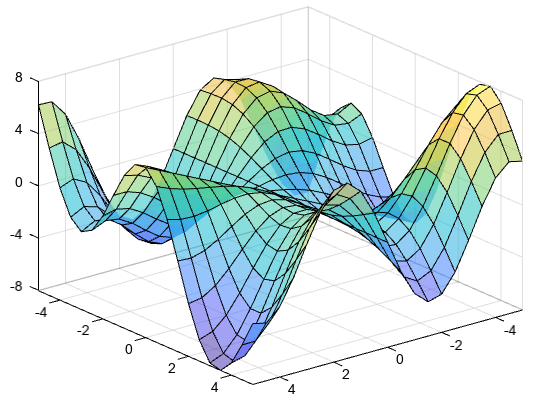
Create a semitransparent surface by specifying the FaceAlpha name-value pair with 0.5 as the value. To allow further modifications, assign the surface object to the variable s.
x, y = meshgrid(arange(-5,5.5,0.5))
z = y * sin(x) + x * cos(y)
s = surf(x, y, z, 20, facealpha=0.5)