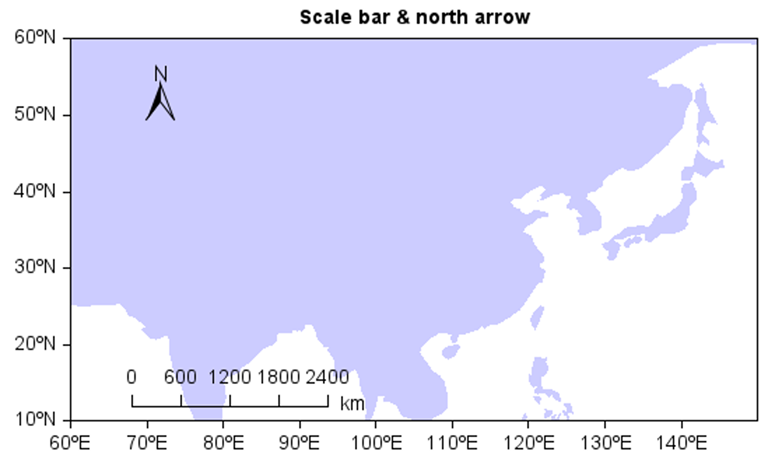
Add north arrow and scale bar
Using north_arrow and scale_bar functions of a map axes object to add north arrow and scale bar
elements in a map plot.
#figure(bgcolor=None)
ax = axesm()
geoshow('continent', facecolor=[204,204,255], edgecolor=None)

#Add scale bar
ax.scale_bar(0.18, 0.25, width=200, linewidth=1, fontsize=14,
    bartype='scale_line_1')

#Add north arrow
ax.north_arrow(0.2, 0.85, width=40, height=40, linewidth=1)

#Set extent
xlim(60, 150)
ylim(10, 60)
xticks(arange(-70, 141, 10))
yticks(arange(10, 61, 10))
title('Scale bar & north arrow')