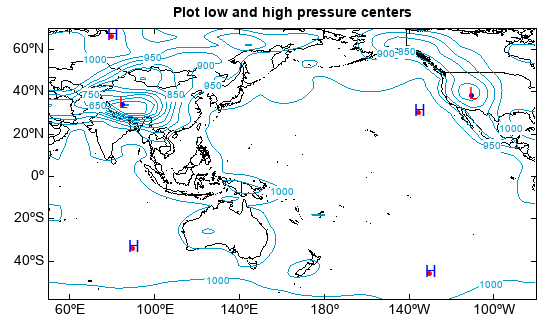
Plot low and high pressure centers
Location lon and high pressure centers using minimum_filter and maximum_filter functions.
f = addfile('D:/Temp/GrADS/model.ctl')
pres = f['PS'][0,'-60:70','50:280']
lat = pres.dimvalue(0)
lon = pres.dimvalue(1)
pres = imagelib.gaussian_filter(pres, sigma=3.0)
mxdata = imagelib.minimum_filter(pres, size=25)
mxy, mxx = np.where(mxdata == pres)
midata = imagelib.maximum_filter(pres, size=25)
miy, mix = np.where(midata == pres)

#Plot
axesm()
geoshow('country')
layer = contour(lon, lat, pres, 10, color=(0,153,204))
clabel(layer, fontsize=10)

for i in range(len(mxy)):
    geoshow(lat[mxy[i]], lon[mxx[i]], color='b', edgecolor=None, size=4)
    text(lon[mxx[i]], lat[mxy[i]], 'L', color='r', xalign='center',
        yalign='center', fontsize=16)
    print(mxdata[mxy[i],mxx[i]])

for i in range(len(miy)):
    geoshow(lat[miy[i]], lon[mix[i]], color='r', edgecolor=None, size=4)
    text(lon[mix[i]], lat[miy[i]], 'H', color='b', xalign='center',
        yalign='center', fontsize=16)
    print(midata[miy[i],mix[i]])

title('Plot low and high pressure centers')