Sub-plot
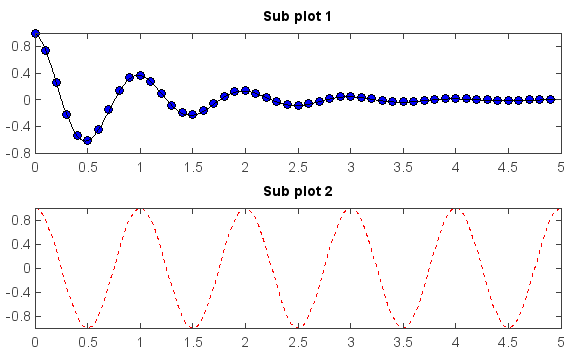
The subplot() function was used to create multiple plots in one figure with same axes
areas.
def f(t):
    return exp(-t) * cos(2*pi*t)

t1 = arange(0., 5., 0.1)
t2 = arange(0., 5., 0.02)

subplot(2,1,1)
plot(t1, f(t1), 'bo', t2, f(t2), 'k')
title('Sub plot 1')

subplot(2,1,2)
plot(t2, cos(2*pi*t2), 'r--')
title('Sub plot 2')
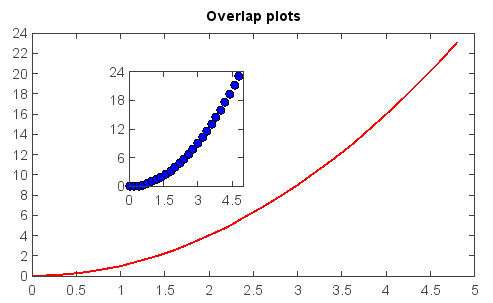
If you want to place an axes manually, i.e.,not on a rectangular grid, use the axes()
command, which allows you to specify the location as axes(position=[left, bottom, width, height])
where all values are in fractional (0 to 1) coordinates.
x = arange(0., 5., 0.2)
y = x**2
plot(x, y, label='Series_1', linewidth=2.0)
title('Overlap plots')
axes(position=[0.3,0.4,0.2,0.4])
plot(x, y, 'bo')