XY plot
XY plot was created by plot() function. More information could be added using title() ,
xlabel() , ylabel() and legend() functions.
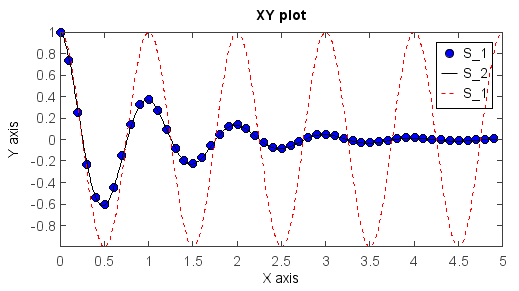
def f(t):
    return exp(-t) * cos(2*pi*t)

t1 = arange(0., 5., 0.1)
t2 = arange(0., 5., 0.02)
plot(t1, f(t1), 'bo', t2, f(t2), 'k')
plot(t2, cos(2*pi*t2), 'r--')
title('XY plot')
xlabel('X axis')
ylabel('Y axis')
legend()