Sea Ice Concentration data
This example code illustrates how to access and visualize a NOAA/NSIDC Climate Data Record of Passive Microwave Sea Ice Concentration data.
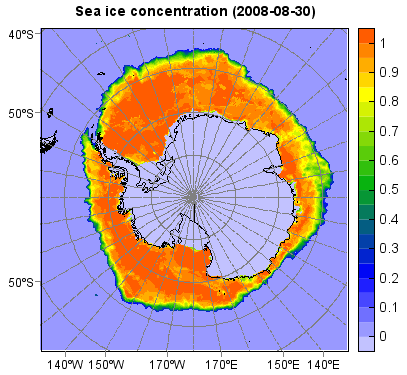
f = addfile('D:/Temp/nc/seaice_conc_daily_sh_f17_20080830_v02r00.nc')
data = f['seaice_conc_cdr'][0,:,:]
#Plot
axesm(projinfo=f.proj, gridline=True)
geoshow('country')
layer = imshow(data, 20, cmap='WhBlGrYeRe', proj=f.proj)
colorbar(layer)
t = f.gettime(0)
title('Sea ice concentration (' + t.strftime('%Y-%m-%d') + ')')