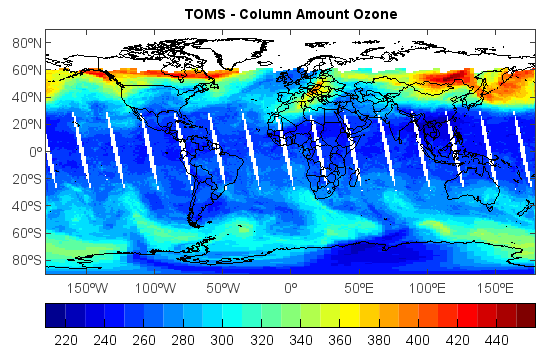
TOMS ozone Grid data
This example code illustrates how to access and visualize a TOMS ozone grid data.
#Add data file
folder = 'D:/Temp/hdf/'
fns = 'TOMS-EP_L3-TOMSEPL3_2000m0101_v8.HDF'
fn = folder + fns
f = addfile(fn)
ozone = f['Ozone'][::-1,:]
#Plot
axesm()
geoshow('country')
layer = imshow(ozone, 20)
colorbar(layer, orientation='horizontal')
title('TOMS - Column Amount Ozone')
axism([-180,180,-90,90])