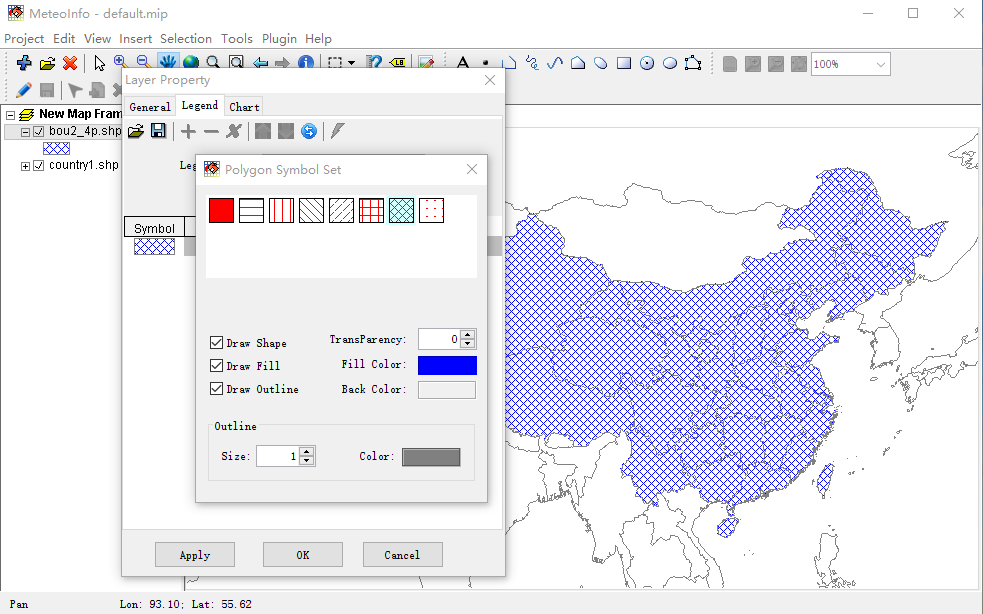
MeteoInfo 1.3.1 was released (2016-3-8)
MeteoInfo 1.3.1 was released. Hatch fill function for polygon shape was added, and several basic hatch patterns
were supported at present. The bar chart can also be filled with hatch pattern by setting hatch argument
in bar() function of MeteoInfoLab. midata module was renamed as minum.
Desktop example:
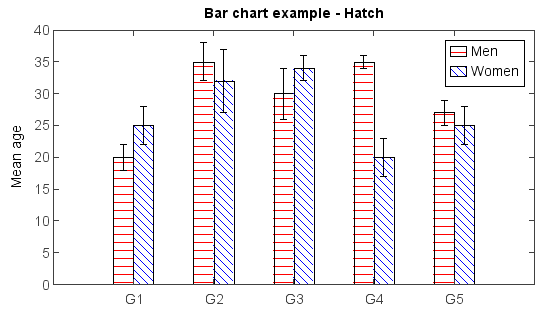
MeteoInfoLab example:
menMeans = [20, 35, 30, 35, 27]
std_men = (2, 3, 4, 1, 2)
bar(menMeans, yerr=std_men, color='r', label='Men', hatch='-')

womenMeans = [25, 32, 34, 20, 25]
std_women = (3, 5, 2, 3, 3)
bar(womenMeans, yerr=std_women, color='b', label='Women', hatch='\\')

ylim(0, 40)
ylabel('Mean age')
xticks(arange(1, len(menMeans) + 1), ['G1','G2','G3','G4','G5'])
legend()
title('Bar chart example - Hatch')