MeteoInfo 1.4.2 was released (2017-3-27)
Polar axes was supported to plot polar chart and windrose chart.
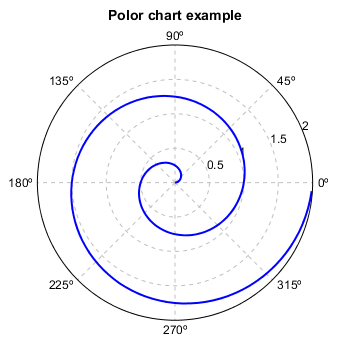
Plot a line in a polar axes
r = arange(0, 2, 0.01)
theta = 2 * pi * r

ax = axes(position=[0.1,0.1,0.8,0.8], polar=True)
plot(theta, r, color='b', linewidth=2)
title('Polor chart example')
antialias(True)
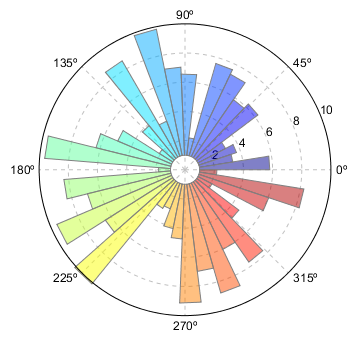
Plot bars in a polar axes
# Compute pie slices
N = 40
theta = linspace(0.0, 2 * pi, N, endpoint=False)
radii = 10 * random.rand(N)
cols = makecolors(N, alpha=0.5)

axes(polar=True)
bars = bar(theta, radii, theta[1]-theta[0], bottom=1, color=cols, edgecolor='gray')
antialias(True)
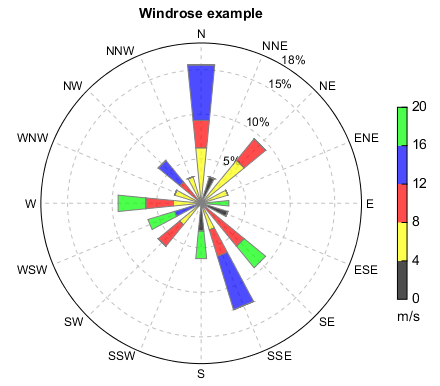
Plot windrose chart
fn = r'D:\Temp\ascii\windrose.txt'
ncol = numasciicol(fn)
nrow = numasciirow(fn)
a = asciiread(fn,shape=(nrow,ncol))
ws=a[:,0]
wd=a[:,1]

n = 16
wsbins = arange(0., 21.1, 4)
cols = makecolors(['k','y','r','b','g'], alpha=0.7)
rtickloc = [0.05,0.1,0.15,0.18]
ax, bars = windrose(wd, ws, n, wsbins, rmax=0.18, colors=cols, rtickloc=rtickloc)
colorbar(bars, shrink=0.6, vmintick=True, vmaxtick=True, xshift=10, \
    label='m/s', labelloc='bottom')
title('Windrose example')