MeteoInfo 1.4.5 was released (2017-7-14)
3-D plot function of surf was added. A rotation tool button was added in MeteoInfoLab
Figure panel for rotate 3-D figure with mouse. The code from SurfacePlotter
(https://github.com/ericaro/surfaceplotter) was used to implement this function.
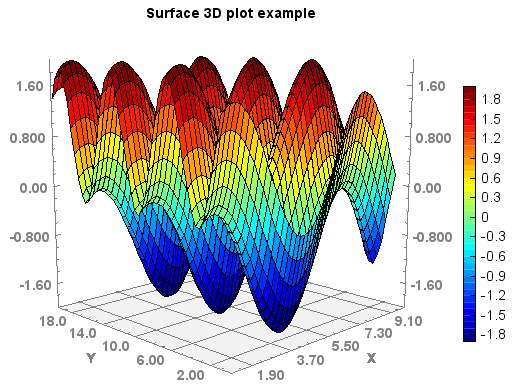
x = arange(1, 10, 0.2)
y = arange(1, 20, 0.4)
x, y = meshgrid(x, y)
z = sin(x) + cos(y)

#Plot
ls = surf(x, y, z, 20)
colorbar(ls,shrink=0.8)
title('Surface 3D plot example')
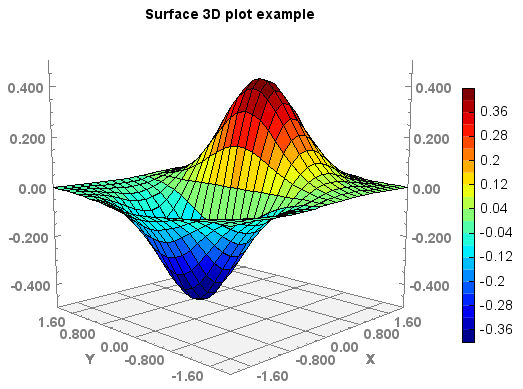
x = linspace(-2, 2, 25)
y = linspace(-2, 2, 25)
x, y = meshgrid(x, y)
z = x * exp(-x ** 2 - y ** 2)

#Plot
ls = surf(x, y, z, 20)
colorbar(ls,shrink=0.8)
title('Surface 3D plot example')