MeteoInfo 1.5 was released (2018-7-9)
Update BIL data reading function.
Update console display functions.
Update netCDf files join function.
Add
linint2function to interpolate from a rectilinear grid to another rectilinear grid using bilinear interpolation.Add
rh2dewpointfunction to convert relative humidity to dew point.Support AMap as web map.
Support MICAPS 131 data format.
Update geotiff read function.
Add
gridshowandstemplot function.Add functions to plot multi color lines.
Read HYSPLIT trajectory data as 2D array.
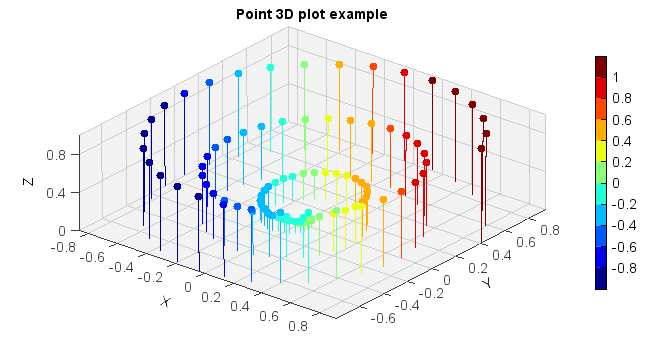
3D stem plot:
z = linspace(0, 1, 100)
x = z * np.sin(20 * z)
y = z * np.cos(20 * z)
c = x + y

#Plot
ax = axes3d()
points, stemlines = ax.stem(x, y, z, c=c, edge=False, samestemcolor=True)
colorbar(stemlines,shrink=0.8)
title('Point 3D plot example')