MeteoInfo 1.7 was released (2018-12-31)
Add
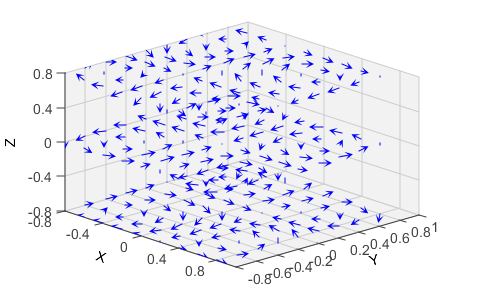
wrf(begining level) andconstantsmodules inmeteolibpackage.Add 3D wind arrow plot function.
Add boundary property im MapAxes for better projected map rendering.
Add
fullfunction for array creating.Add ablility to draw legend title.
Update
cressmanfunction and addbarnesfunction.Fixed the bug of reading HYSPLIT concentration data. And many other bug fixed.
3D wind arrow plot:
# Make the grid
x, y, z = meshgrid(arange(-0.8, 1, 0.2),
                   arange(-0.8, 1, 0.2),
                   arange(-0.8, 1, 0.8))

# Make the direction data for the arrows
u = sin(pi * x) * cos(pi * y) * cos(pi * z)
v = -cos(pi * x) * sin(pi * y) * cos(pi * z)
w = (sqrt(2.0 / 3.0) * cos(pi * x) * cos(pi * y) *
     sin(pi * z))

ax = axes3d()
qq = ax.quiver(x, y, z, u, v, w, color='b', length=0.1)
#ax.scatter(x, y, z)
xlim(-0.8, 1)
ylim(-0.8, 1)
#zlim(-1, 1)
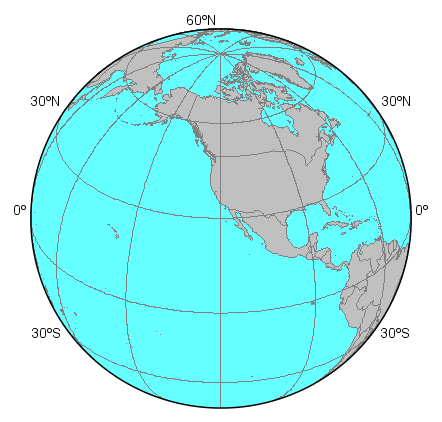
Orthographic projection:
proj = projinfo(proj='ortho', lon_0=-120, lat_0=30)
axesm(projinfo=proj, gridline=True, gridlabelloc='all', griddx=30, \
    griddy=30, frameon=False, cutoff=10, \
    boundaryprop={'facecolor':(102,255,255),'edgesize':1.5})
geoshow('country', facecolor='lightgray', edgecolor='gray')
axism()