MeteoInfo 3.0.0 was released (2021-5-11)
Code refactoring - split MeteoInfoLib to several modules: common, ndarray, geometry, table, ui, projection, math, image, dataframe, data, console, geo, chart, map, lab.
Using OpenBLAS to speed up scientific computation functions.
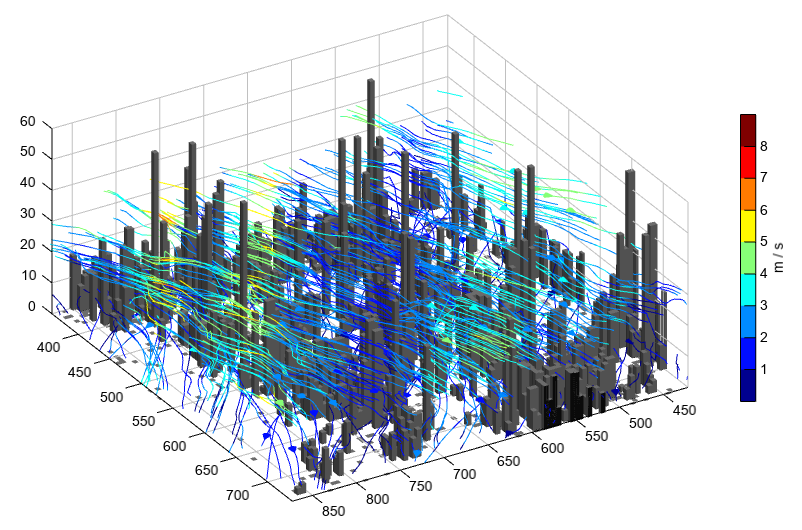
Add 3D streamline tracing functions.
Add Kriging interpolation algorithm.
Add 3D trajectory clustering function.
Add signal package and detrend function.
Add spatial package and pdist function.
Add tofile and fromfile functions.
Support MICAPS MDFS data file format.
Update contour and contourf functions to support 2d x/y coordinates.
Update FlatLaf to version 1.1.2.
Update Proj4j to version 1.1.2.
Update NetCDF to version 5.4.1.
update itextpdf to version 5.5.13.2
Update guava to version 30.1.1
Some bug fixed.
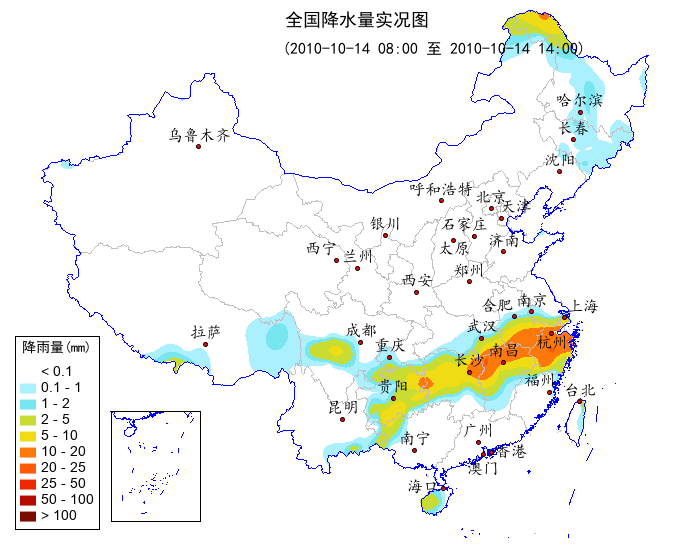
Kriging interpolation:
fn = os.path.join(migl.get_sample_folder(), 'MICAPS', '10101414.000')
f = addfile_micaps(fn)
pr = f['Precipitation6h'][:]
lon = f['Longitude'][:]
lat = f['Latitude'][:]

mask_rect = geolib.polygon([72,72,136,136], [16,55,55,16])
pr,lon,lat = geolib.rmaskout(pr, lon, lat, mask_rect)
idx = where(pr != nan)
pr = pr[idx]
lon = lon[idx]
lat = lat[idx]

#griddata function - interpolate
x = arange(75, 135, 0.5)
y = arange(18, 55, 0.5)
prg = griddata((lon, lat), pr, xi=(x, y), method='kriging')[0]

#Plot
figure(figsize=[700,550], newfig=False)
proj = projinfo(proj='lcc', lon_0=105, lat_1=25, lat_2=47)
axesm(projinfo=proj, position=[0.01, 0.01, 0.99, 0.99], axison=False, gridlabel=False, frameon=False)
geoshow('cn_province', edgecolor='lightgray')
bou1_layer = geoshow('cn_border', facecolor=(0,0,255))
city_layer = geoshow('cn_cities', facecolor='r', size=4)
city_layer.addlabels('NAME', fontname=u'楷体', fontsize=16, yoffset=15, avoidcoll=False)
china_layer = geoshow('china', visible=False)
city_layer.movelabel(u'西宁', -15)
city_layer.movelabel(u'海口', -20, -10)
city_layer.movelabel(u'澳门', 0, -25)
city_layer.movelabel(u'香港', 20, -10)
city_layer.movelabel(u'福州', -10)
city_layer.movelabel(u'合肥', -18)
city_layer.movelabel(u'杭州', 0, -20)
city_layer.movelabel(u'上海', 18)
city_layer.movelabel(u'太原', 0, -20)
city_layer.movelabel(u'天津', 15)
city_layer.movelabel(u'石家庄', -10)
levs = [0.1, 1, 2, 5, 10, 20, 25, 50, 100]
cols = [(255,255,255),(170,240,255),(120,230,240),(200,220,50),(240,220,20),(255,120,10),(255,90,10), \
    (240,40,0),(180,10,0),(120,10,0)]
layer = contourf(x, y, prg, levs, colors=cols)
masklayer(china_layer, [layer])
legend(layer, loc='lower left', frameon=True, title=u'降雨量(mm)', titlefontname=u'黑体')
axism([79, 128, 14, 53])
text(95, 53, u'全国降水量实况图', fontname=u'黑体', fontsize=18)
text(95, 51, u'(2010-10-14 08:00 至 2010-10-14 14:00)', fontname=u'黑体', fontsize=16)

#Add south China Sea
sc_layer = bou1_layer.clone()
axesm(position=[0.15,0.05,0.15,0.2], axison=False, frameon=True)
geoshow(sc_layer, facecolor=(0,0,255))
xlim(106, 123)
ylim(2, 23)
3D stream plot:
ddir = u'D:/Temp/nc/风场'
hfn = os.path.join(ddir, 'hhgt.nc')
hf = addfile(hfn)
ll = 5
zz = hf['HGT'][0:ll]
x = zz.dimvalue(2)
y = zz.dimvalue(1)
s = 15
zz = zz[:,::s,::s]
zz[zz==0] = nan
x1 = x[::s]
y1 = y[::s]
z1 = arange(ll) * 10

fn = os.path.join(ddir, '1.nc')
f = addfile(fn)
ss = 5
hgt = f['HGT'][0]
hgt = hgt[::ss,::ss]
hgt[hgt==0] = nan
x2 = x[::ss]
y2 = y[::ss]

u = f['U'][0,0:ll]
u = u[:,::s,::s]
v = f['V'][0,0:ll]
v = v[:,::s,::s]
w = f['W'][0,0:ll]
w = w[:,::s,::s]
xx, yy = meshgrid(x2, y2)
xx1, yy1, zz1 = meshgrid(x1, y1, z1)
speed = sqrt(u*u + v*v + w*w)
#u[speed < 0.3] = nan

axes3d()
lighting(True)
qq = streamplot3(x1, y1, z1, u, v, w, speed, linewidth=1,
    density=4, interval=100, lighting=False)
bar3(xx, yy, hgt, width=ss, facecolor='gray', edgecolor=None)
colorbar(qq, aspect=30, label='m / s')
antialias(True)