Add an map axes to the figure.
| Parameters: |
|
|---|---|
| Returns: | The map axes. |
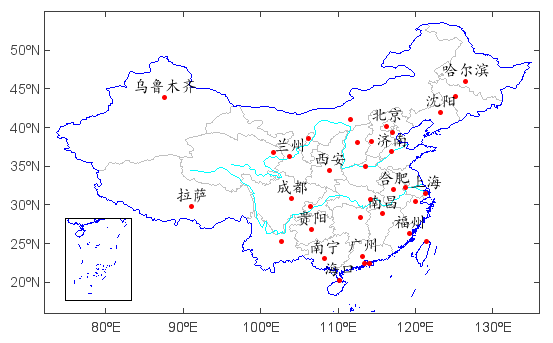
Example:
#Set data folders
basedir = 'D:/MyProgram/Distribution/java/MeteoInfo/MeteoInfo'
mapdir = os.path.join(basedir, 'map')
#Read shape files
bou2_layer = shaperead(os.path.join(mapdir, 'bou2_4p.shp'))
bou1_layer = shaperead(os.path.join(mapdir, 'bou1_4l.shp'))
river_layer = shaperead(os.path.join(mapdir, 'rivers.shp'))
city_layer = shaperead(os.path.join(mapdir, 'res1_4m.shp'))
#Plot
axesm()
geoshow(bou2_layer, edgecolor='lightgray')
geoshow(bou1_layer, facecolor=(0,0,255))
ss = makesymbolspec('line', {'value':'Yangtze', 'color':(0,255,255), 'size':1}, \
    {'value':'Huang He', 'color':(0,255,255), 'size':1}, field='NAME')
geoshow(river_layer, symbolspec=ss)
geoshow(city_layer, facecolor='r', size=4, labelfield='NAME', fontname=u'楷体', fontsize=16, yoffset=15)
xlim(72, 136)
ylim(16, 55)
#Add south China Sea
sc_layer = shaperead(os.path.join(mapdir, 'bou1_4l.shp'))
axesm(position=[0.14,0.18,0.15,0.2], axison=False)
geoshow(sc_layer, facecolor=(0,0,255))
xlim(106, 123)
ylim(2, 23)