Returen a subplot axes positioned by the given grid definition.
| Parameters: |
|
|---|---|
| Returns: | Current axes specified by plot_number . |
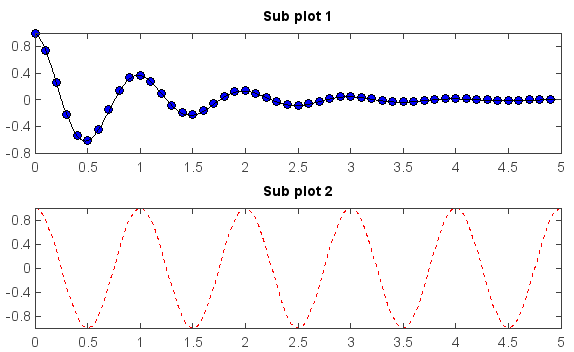
Example:
def f(t):
    return exp(-t) * cos(2*pi*t)

t1 = arange(0., 5., 0.1)
t2 = arange(0., 5., 0.02)

subplot(2,1,1)
plot(t1, f(t1), 'bo', t2, f(t2), 'k')
title('Sub plot 1')

subplot(2,1,2)
plot(t2, cos(2*pi*t2), 'r--')
title('Sub plot 2')