Places a legend on the axes.
| Parameters: |
|
|---|
Example:
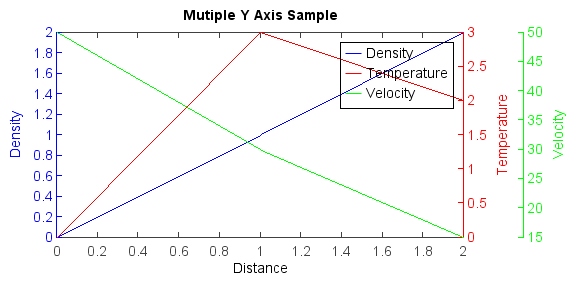
ax1 = axes(position=[0.113,0.15,0.7,0.8])
yaxis(ax1, color='b')
line1 = plot([0, 1, 2], [0, 1, 2], 'b-', label="Density")
xlabel('Distance')
ylabel('Density', color='b')
title('Mutiple Y Axis Sample')

ax2 = twinx(ax1)
yaxis(ax2, color='r')
line2 = plot([0, 1, 2], [0, 3, 2], 'r-', label="Temperature")
ylabel('Temperature', color='r')

ax3 = twinx(ax1)
yaxis(ax3, shift=60, color='g')
line3 = plot([0, 1, 2], [50, 30, 15], 'g-', label="Velocity")
ylabel('Velocity', color='g')
lines = [line1, line2, line3]
legend(lines)