Make a plot with log scaling on both x and y axis.
| Parameters: |
|
|---|---|
| Returns: | Legend breaks of the lines. |
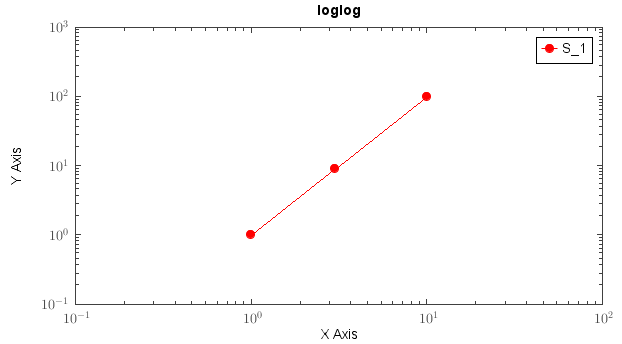
Examples:
x = [1,3,10]
y = [1,9,100]
loglog(x, y, 'r-o')
ylabel('Y Axis')
xlabel('X Axis')
xlim(1e-1, 1e2)
ylim(1e-1, 1e3)
legend()
set(plt.gca, xminortick=True, yminortick=True)
title('loglog')