Make a plot with log scaling on x axis.
| Parameters: |
|
|---|---|
| Returns: | Legend breaks of the lines. |
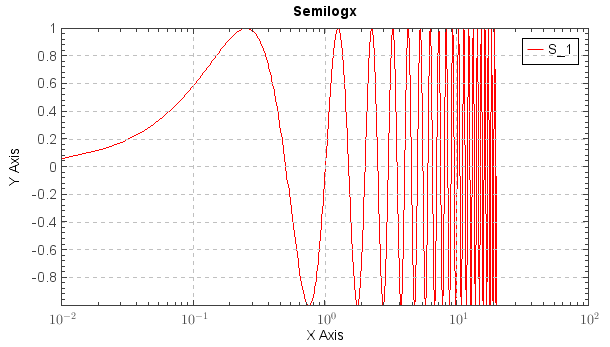
Examples:
t = arange(0.01, 20.0, 0.01)
semilogx(t, sin(2*pi*t))
grid(True)
ylabel('Y Axis')
xlabel('X Axis')
legend()
set(plt.gca, xminortick=True, yminortick=True)
title('Semilogx')