Plot a pie chart.
Make a pie chart of array x. The fraction area of each wedge is given by x/sum(x). If sum(x) <= 1, then the values of x give the fractional area directly and the array will not be normalized. The wedges are plotted counterclockwise, by default starting from the x-axis.
| Parameters: |
|
|---|---|
| Radius: | (float) The radius of the pie, if radius is None it will be set to 1. |
| Returns: | (tuple) Patches and texts. |
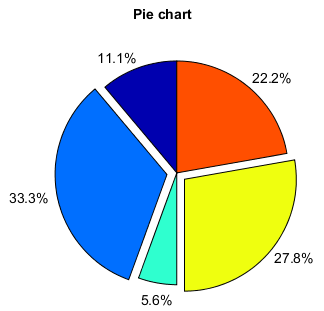
Examples:
x = [1, 3, 0.5, 2.5, 2]
pie(x, explode=[0,1,0,1,0], startangle=90, autopct='%.1f%%')
title('Pie chart')