Make a scatter plot of x vs y, where x and y are sequence like objects of the same lengths.
| Parameters: |
|
|---|---|
| Returns: | Points legend break. |
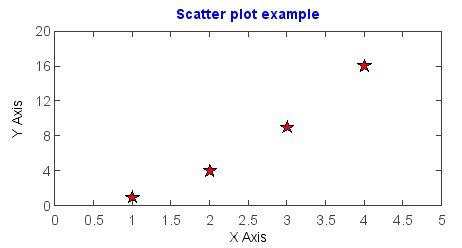
Examples:
x = [1,2,3,4]
y = [1,4,9,16]
scatter(x, y, marker='S', s=14, color='r')
ylabel('Y Axis')
xlabel('X Axis')
axis([0,5,0,20])
title('Scatter plot example', color='b')