Plot lines and/or markers to the axes. args is a variable length argument, allowing for multiple x, y pairs with an optional format string.
| Parameters: |
|
|---|---|
| Returns: | Legend breaks of the lines. |
The following format string characters are accepted to control the line style or marker:
Character Description ‘-‘ solid line style ‘–’ dashed line style ‘-.’ dash-dot line style ‘:’ dotted line style ‘.’ point marker ‘,’ pixel marker ‘o’ circle marker ‘v’ triangle_down marker ‘^’ triangle_up marker ‘<’ triangle_left marker ‘>’ triangle_right marker ‘s’ square marker ‘p’ pentagon marker ‘*’ star marker ‘x’ x marker ‘D’ diamond marker
The following color abbreviations are supported:
Character Color ‘b’ blue ‘g’ green ‘r’ red ‘c’ cyan ‘m’ magenta ‘y’ yellow ‘k’ black
Examples:
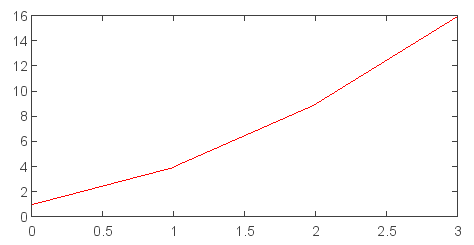
y = [1,4,9,16]
plot(y)    # plot y using x as index array 0..N-1
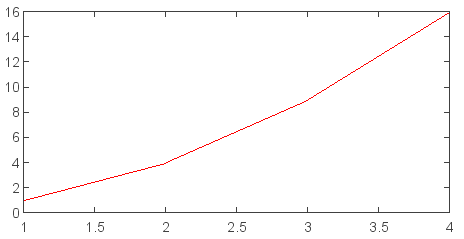
x = [1,2,3,4]
y = [1,4,9,16]
plot(x, y)    # plot x and y using default line style and color
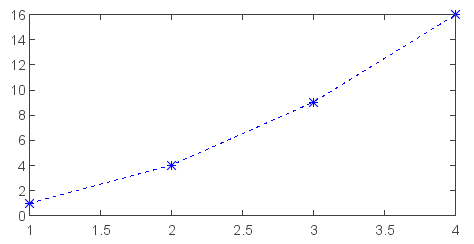
x = [1,2,3,4]
y = [1,4,9,16]
plot(x, y, 'b--*')    # plot x and y using blue dash line and star marker style
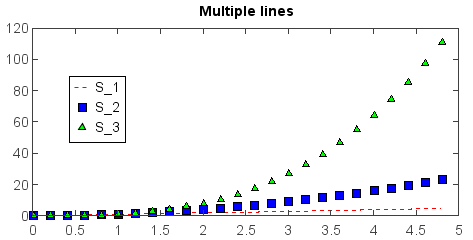
t = arange(0., 5., 0.2)
plot(t, t, 'r--', t, t**2, 'bs', t, t**3, 'g^')
legend(loc='custom',x=0.2,y=0.4)
title('Multiple lines')