Plot lines and/or markers to the map.
| Parameters: |
|
|---|---|
| Returns: | (VectoryLayer) Line VectoryLayer. |
Examples
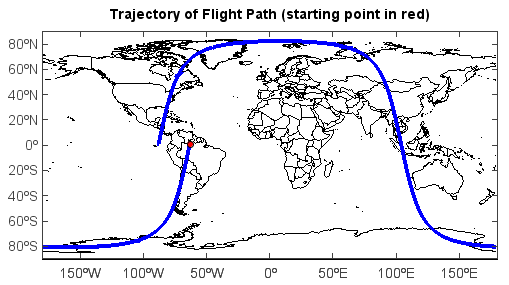
f = addfile('D:/Temp/hdf/2010128055614_21420_CS_2B-GEOPROF_GRANULE_P_R04_E03.hdf')
lon = f['Longitude'][:]
lat = f['Latitude'][:]
axesm()
lworld = shaperead('D:/Temp/map/country1.shp')
geoshow(lworld, edgecolor='k')
plotm(lon, lat, '-b', linewidth=4)
scatterm(lon[0], lat[0], size=6, facecolor='r')
xlim(-180, 180)
ylim(-90, 90)
title('Trajectory of Flight Path (starting point in red)')