Make a scatter plot on a map.
| Parameters: |
|
|---|---|
| Returns: | (VectoryLayer) Point VectoryLayer. |
Examples:
f = addfile_micaps('D:/Temp/micaps/10101414.000')
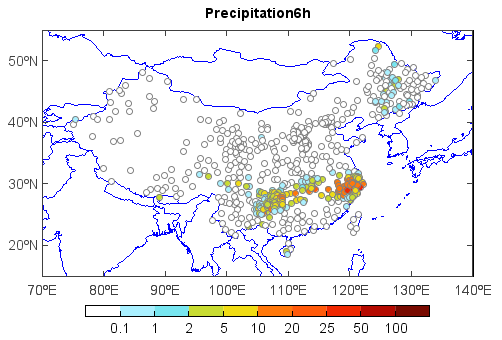
vname = 'Precipitation6h'
pr = f[vname][:]
lon = f['Longitude'][:]
lat = f['Latitude'][:]
layer = shaperead('D:/Temp/map/china.shp')
pr, lon, lat = rmaskout(pr, lon, lat, layer.shapes())
axesm()
mlayer = shaperead('D:/Temp/map/country1.shp')
geoshow(mlayer, edgecolor=(0,0,255))
levs = [0.1, 1, 2, 5, 10, 20, 25, 50, 100]
cols = [(255,255,255),(170,240,255),(120,230,240),(200,220,50),(240,220,20),(255,120,10),(255,90,10), \
(240,40,0),(180,10,0),(120,10,0)]
layer = scatterm(lon, lat, pr, levs, colors = cols, s=2, edgecolor='gray')
title(vname)
yticks(arange(20, 51, 10))
xlim(70, 140)
ylim(15, 55)
colorbar(layer, orientation='horizontal', shrink=0.8, aspect=30)