Make a plot with log scaling on y axis.
| Parameters: |
|
|---|---|
| Returns: | Legend breaks of the lines. |
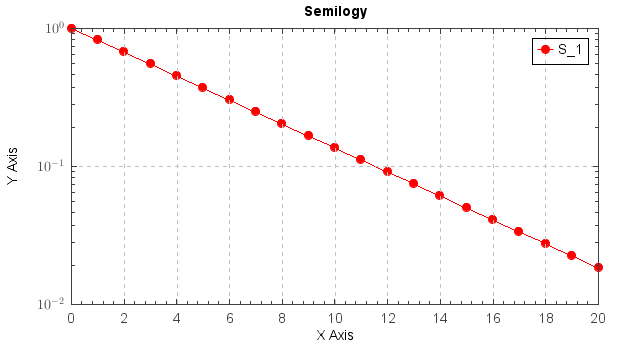
Examples:
x = arange(0, 20.1, 1.0)
y = exp(-x/5.0)
semilogy(x, y, 'r-o')
grid(True)
ylabel('Y Axis')
xlabel('X Axis')
legend()
xlim(0,20)
set(plt.gca, xminortick=True, yminortick=True)
title('Semilogy')