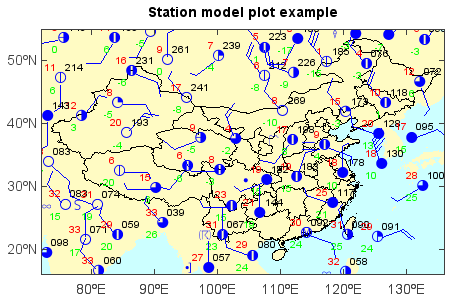
Plot station model data on the map.
| Parameters: |
|
|---|---|
| Returns: | (VectoryLayer) Station model VectoryLayer. |
Examples
#Set data folders
basedir = 'D:/MyProgram/Distribution/java/MeteoInfo/MeteoInfo'
datadir = os.path.join(basedir, 'sample/MICAPS')
mapdir = os.path.join(basedir, 'map')
#Read shape files
lworld = shaperead(os.path.join(mapdir, 'country1.shp'))
lchina = shaperead(os.path.join(mapdir, 'bou2_4p.shp'))
#Read station data
f = addfile_micaps(os.path.join(datadir, '10101414.000'))
data = f.smodeldata()
#Plot
axesm(bgcolor=(204,255,255))
geoshow(lworld, facecolor=(255,251,195))
geoshow(lchina, edgecolor='k')
layer = stationmodel(data, size=14)
yticks([20,30,40,50])
title('Station model plot example')
xlim(72, 136)
ylim(16, 55)