Plot streamline in a map.
| Parameters: |
|
|---|---|
| Returns: | (VectoryLayer) Created streamline VectoryLayer. |
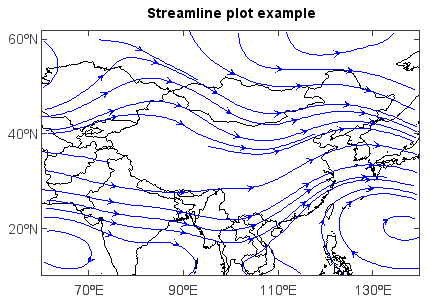
Example:
f = addfile('D:/Temp/GrADS/model.ctl')
u = f['U'][0,'500','10:60','60:140']
v = f['V'][0,'500','10:60','60:140']
axesm()
mlayer = shaperead('D:/Temp/map/country1.shp')
geoshow(mlayer, edgecolor='k')
layer = streamplotm(u, v)
title('Streamline plot example')
yticks([20,40,60])