title
xlabel
Enter search terms or a module, class or function name.
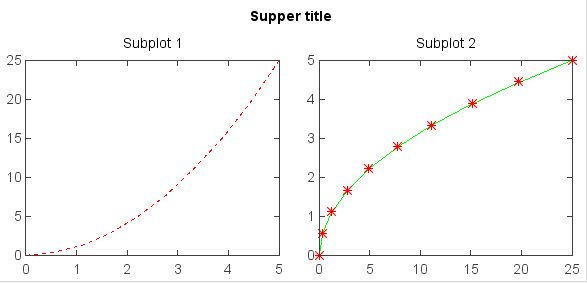
Add a centered title to the figure.
Example:
x = linspace(0, 5, 10)
y = x ** 2
subplot(1,2,1)
plot(x, y, 'r--')
title('Subplot 1', bold=False)
subplot(1,2,2)
plot(y, x, 'g*-')
title('Subplot 2', bold=False)
suptitle('Supper title')