Set a title of the current axes.
| Parameters: |
|
|---|
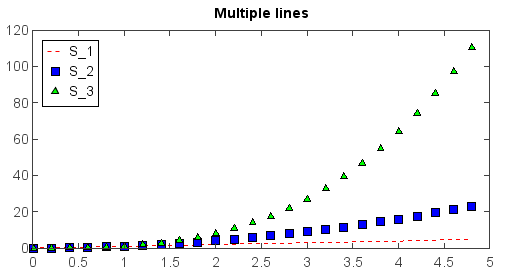
Example:
t = arange(0., 5., 0.2)
plot(t, t, 'r--', t, t**2, 'bs', t, t**3, 'g^')
legend(loc='upper left')
title('Multiple lines')
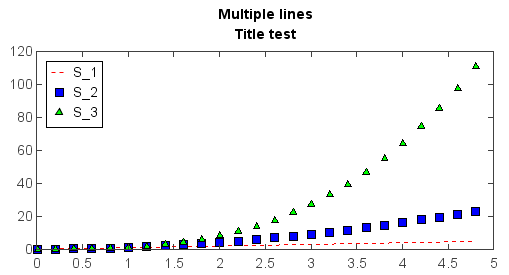
Multiple rows title can be added using string list:
t = arange(0., 5., 0.2)
plot(t, t, 'r--', t, t**2, 'bs', t, t**3, 'g^')
legend(loc='upper left')
title(['Multiple lines', 'Title test'])