Set the x-limits of the current tick locations and labels.
| Parameters: |
|
|---|
Example:
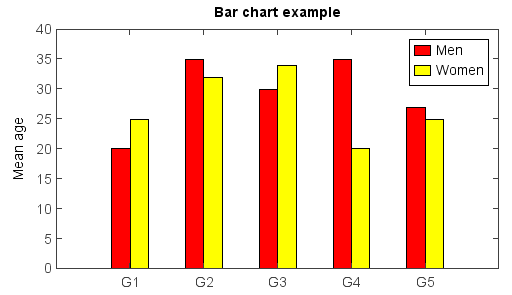
menMeans = [20, 35, 30, 35, 27]
bar(menMeans, color='r', label='Men')
womenMeans = [25, 32, 34, 20, 25]
bar(womenMeans, color='y', label='Women')
ylim(0, 40)
ylabel('Mean age')
xticks(arange(1, len(menMeans) + 1), ['G1','G2','G3','G4','G5'])
legend()
title('Bar chart example')