xlabel
xticks
Enter search terms or a module, class or function name.
Set the y axis label of the current axes.
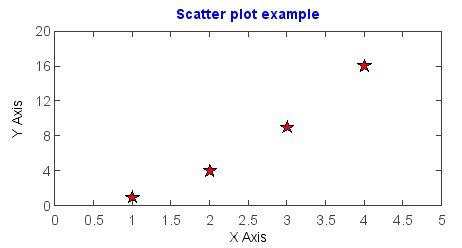
Example:
x = [1,2,3,4]
y = [1,4,9,16]
scatter(x, y, marker='S', s=14, color='r')
ylabel('Y Axis')
xlabel('X Axis')
axis([0,5,0,20])
title('Scatter plot example', color='b')