contour
- mipylib.plotlib.miplot.contour(*args, **kwargs)
Plot contours.
- Parameters:
x – (array_like) Optional. X coordinate array.
y – (array_like) Optional. Y coordinate array.
z – (array_like) 2-D z value array.
levs – (array_like) Optional. A list of floating point numbers indicating the level curves to draw, in increasing order.
cmap – (string) Color map string.
colors – (list) If None (default), the colormap specified by cmap will be used. If a string, like ‘r’ or ‘red’, all levels will be plotted in this color. If a tuple of matplotlib color args (string, float, rgb, etc), different levels will be plotted in different colors in the order specified.
- Returns:
(VectoryLayer) Contour VectoryLayer created from array data.
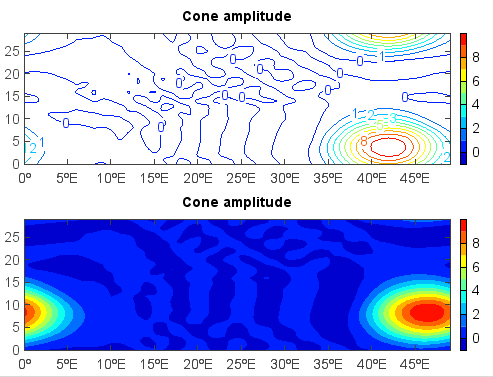
Example:
f = addfile('D:/Temp/nc/cone.nc')
u = f['u'][4,:,:]
subplot(2,1,1)
layer = contour(u)
clabel(layer)
title('Cone amplitude')
colorbar(layer)

subplot(2,1,2)
u = f['u'][5,:,:]
layer = contourf(u)
title('Cone amplitude')
colorbar(layer)