Histogram chart
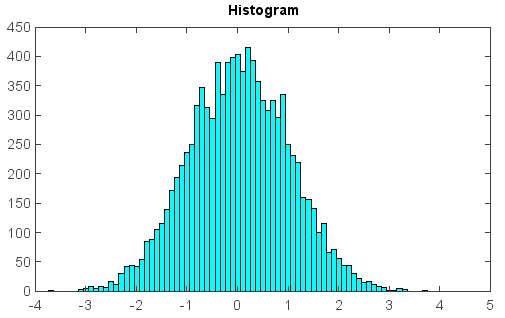
Histogram chart was created by hist() function.
x = random.randn(10000)
hist(x, bins=50, color='c')
title('Histogram')
Histogram chart was created by hist() function.
x = random.randn(10000)
hist(x, bins=50, color='c')
title('Histogram')

