Step plot
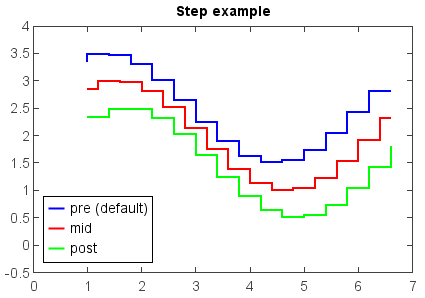
Step plot was created by step() function.
x = arange(1, 7, 0.4)
y0 = sin(x)
y = y0 + 2.5
step(x, y, label='pre (default)', color='b', linewidth=2)
y -= 0.5
step(x, y, where='mid', label='mid', color='r', linewidth=2)
y -= 0.5
step(x, y, where='post', label='post', color='g', linewidth=2)
legend(loc='lower left')
xlim(0, 7)
ylim(-0.5, 4)
title('Step example')