Weather symbol plot
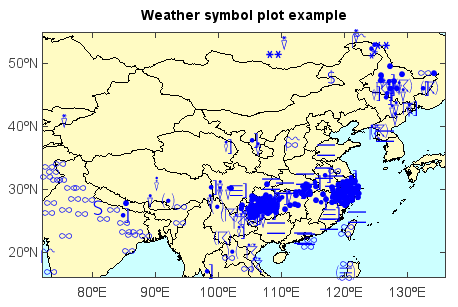
Weather symbol plot was created by scatter() function with weather specific legend
created by weatherspec() function.
#Add file and read data array
fn = os.path.join(migl.get_sample_folder(), 'MICAPS', '10101414.000')
f = addfile_micaps(fn)
data = f['WeatherNow'][:]
lon = f['Longitude'][:]
lat = f['Latitude'][:]
#Plot
axesm(bgcolor=(204,255,255))
geoshow('country', edgecolor='k', facecolor=(255,251,195))
geoshow('cn_province', edgecolor='k')
ls = weatherspec()
layer = scatter(lon, lat, data, symbolspec=ls)
yticks([20,30,40,50])
title('Weather symbol plot example')
xlim(72, 136)
ylim(16, 55)