MODIS AOD data - MOD08
This example code illustrates how to access and visualize a MODIS AOD (MOD08) data.
f = addfile('D:/Temp/hdf/MOD08_D3.A2015121.051.2015122103938.pscs_000500931513.Optical_Depth_Land_And_Ocean_Mean.G3.hdf')
v_aod = f['Optical_Depth_Land_And_Ocean_Mean']
#Set x/y
x = linspace(-180.0,180.0, 360)
y = linspace(-90.0,90.0, 180)
#Set x/y dimensions
v_aod.setdim('Y', y)
v_aod.setdim('X', x)
#Get data
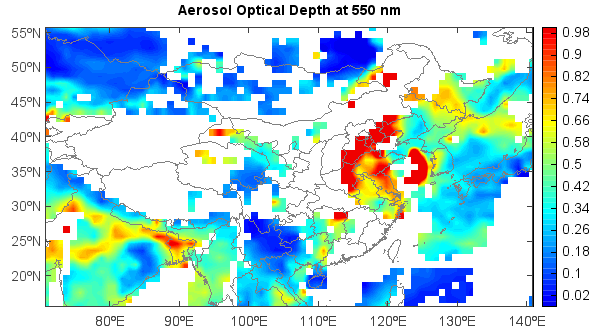
aod = v_aod['15:55','70:140']
#Plot
axesm()
geoshow('cn_province', edgecolor='gray')
geoshow('country')
levels = arange(0, 1.0, 0.02)
layer = contourf(aod, levels, interpolate=True)
title('Aerosol Optical Depth at 550 nm')
colorbar(layer)