MeteoInfo 2.0 was released (2019-9-26)
Add OpenGL support 3D chart functions through JOGL library.
Support isosurface 3D plot.
Several bug fixed.
Create an OpenGL support 3D axes (Axes3DGL object) using axes3dgl function. The usage of plot
functions is similar with Axes3D object.
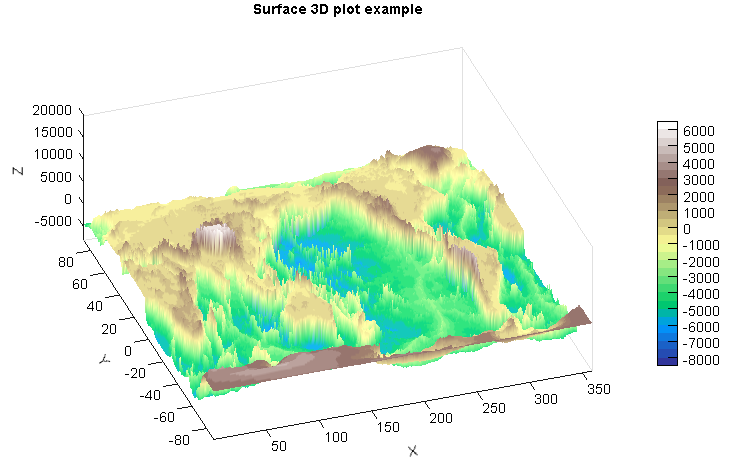
Relief surface plot:
import time

#Relief data
fn = 'D:/Temp/nc/elev.0.25-deg.nc'
f = addfile(fn)
elev = f['data'][0,::4,::4]
lon = elev.dimvalue(1)
lat = elev.dimvalue(0)
lon, lat = meshgrid(lon, lat)

#Plot
st = time.clock()
ax = axes3dgl()
ax.set_lighting(True, position=[0,0,1,0], ambient=[0.2,0.2,0.2,1])
ls = ax.plot_surface(lon, lat, elev, 20, cmap='MPL_terrain', edge=False)
zlim(-8000, 20000)
colorbar(ls,shrink=0.8)
title('Surface 3D plot example')
et = time.clock()
print(et - st)
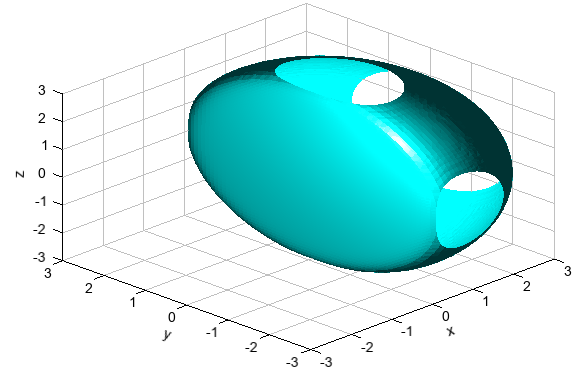
Isosurface plot:
x = y = z = arange(-3, 3.1, 0.5)
xx,yy,zz = meshgrid(x, y, z)
v = xx*exp(-xx**2 - yy**2 - zz**2)

#Plot
ax = axes3dgl()
ax.set_lighting(True, position=[-1,-1,1,1])
ax.plot_isosurface(x, y, z, v, 1e-5, color='c', edge=False, nthread=4)
xlim(-3, 3)
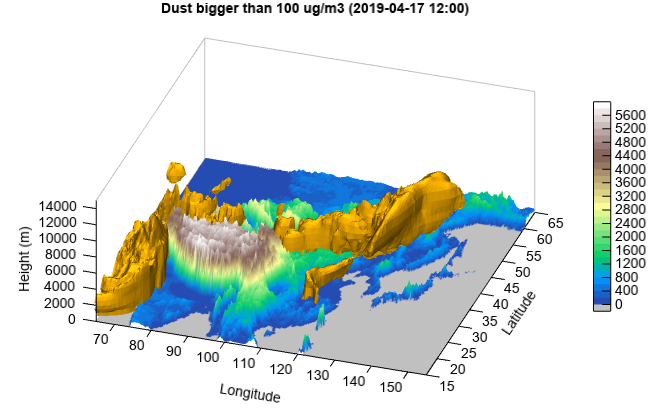
3D sand and dust storm plot:
#Set date
sdate = datetime.datetime(2019, 4, 17, 0)

#Set directory
datadir = 'D:/Temp/mm5'

#Read data
fn = os.path.join(datadir, 'WMO_SDS-WAS_Asian_Center_Model_Forecasting_CUACE-DUST_CMA_'+ sdate.strftime('%Y%m%d%H') + '.nc')
f = addfile(fn)
st = f.gettime(0)
t = 10
dust = f['CONC_DUST'][t,:,:,:]
levels = dust.dimvalue(0)
dust[dust<5] = 0
height = meteolib.pressure_to_height_std(levels)
lat = dust.dimvalue(1)
lon = dust.dimvalue(2)

#Relief data
fn = 'D:/Temp/nc/elev.0.25-deg.nc'
f = addfile(fn)
elev = f['data'][0,'15:65','65:155']
elev[elev<0] = -1
lon1 = elev.dimvalue(1)
lat1 = elev.dimvalue(0)
lon1, lat1 = meshgrid(lon1, lat1)

#Plot
ax = axes3dgl(bbox=True)
ax.set_rotation(348)
ax.set_elevation(-29)
ax.set_lighting(True)
levs = arange(0, 6000, 200)
cols = makecolors(len(levs) + 1, cmap='MPL_terrain')
cols[0] = 'w'
ls = ax.plot_surface(lon1, lat1, elev, levs, colors=cols, edge=False)
ax.plot_isosurface(lon, lat, height, dust, 100, color=[255,180,0,10], \
    edge=False, nthread=4)
colorbar(ls)
xlim(65, 155)
xlabel('Longitude')
ylim(15, 65)
ylabel('Latitude')
zlim(0, 15000)
zlabel('Height (m)')
#zticks(arange(len(levels))[1:], levels[1:])
tt = st + datetime.timedelta(hours=t*3)
title('Dust bigger than 100 ug/m3 (%s)' % tt.strftime('%Y-%m-%d %H:00'))