MeteoInfo 2.1 was released (2020-1-22)
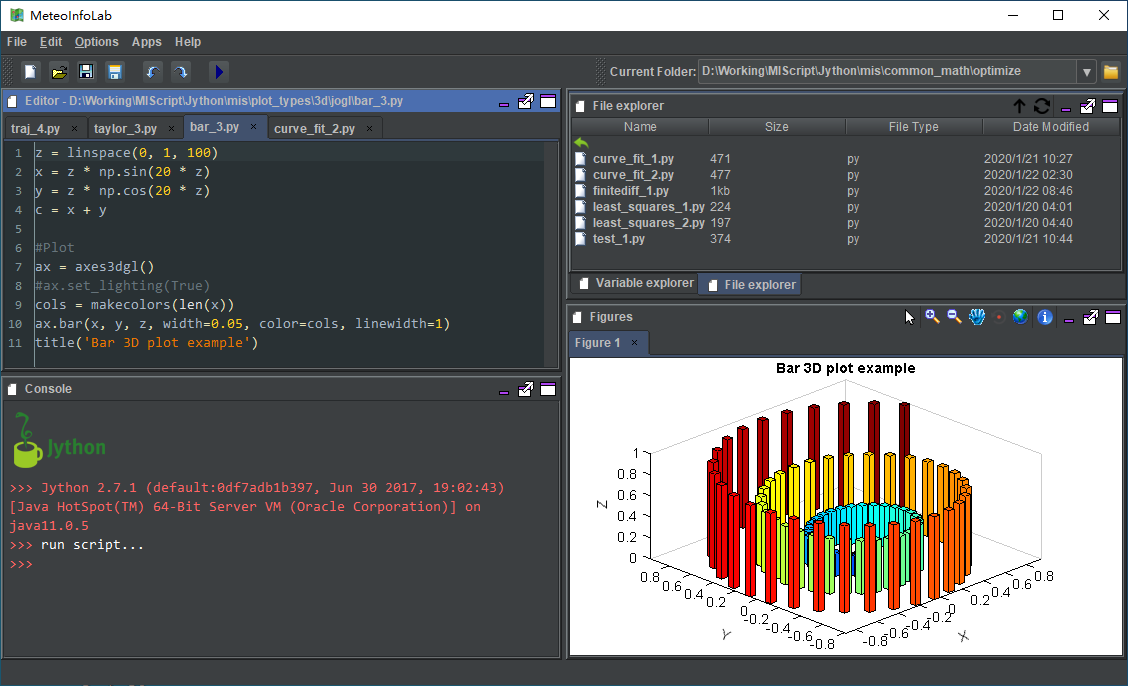
Add 3D bar plot.
Support log axis in 3D plot.
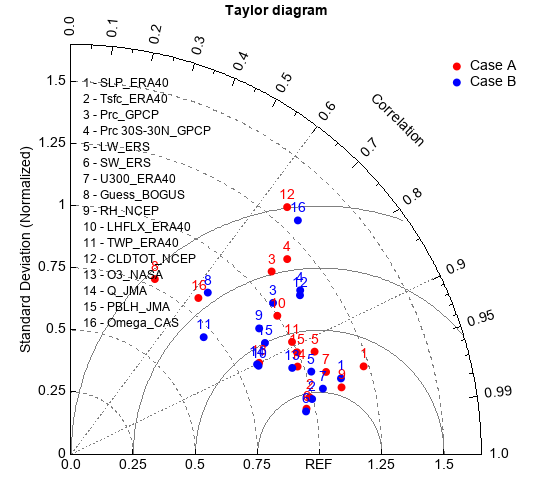
Add taylor_diagram plot.
Add streamline support in Plot2D.
Add multiple look and feel support, including
Darcular.Add find/replace, comment, insert tab, delete tab functions to code editor.
Update
rsyntaxtextareato version 3.0.4.Update
proj4jto version 1.1.0.Update
JTSto version 1.16.1.Add base attribute to Array.
Add min max gaussian filter functions.
Source code set to Java 8.
Several bug fixed.
Darcula look & feel and 3D bar plot
taylor_diagram plot:
case = ['Case A', 'Case B']
ncase = len(case)

var = ["SLP","Tsfc" ,"Prc","Prc 30S-30N","LW","SW", "U300", "Guess",
    "RH" ,"LHFLX","TWP","CLDTOT","O3","Q" , "PBLH", "Omega"]
nvar = len(var)

source = ["ERA40", "ERA40","GPCP" , "GPCP", "ERS", "ERS", "ERA40", "BOGUS",
    "NCEP",  "ERA40","ERA40", "NCEP", "NASA", "JMA", "JMA" , "CAS"]

#Case A
CA_ratio = np.array([1.230, 0.988, 1.092, 1.172, 1.064, 0.966, 1.079, 0.781,
            1.122, 1.000, 0.998, 1.321, 0.842, 0.978, 0.998, 0.811])
CA_cc = np.array([0.958, 0.973, 0.740, 0.743, 0.922, 0.982, 0.952, 0.433,
                0.971, 0.831, 0.892, 0.659, 0.900, 0.933, 0.912, 0.633])

#Case B
CB_ratio = np.array([1.129, 0.996, 1.016, 1.134, 1.023, 0.962, 1.048, 0.852,
                0.911, 0.835, 0.712, 1.122, 0.956, 0.832, 0.900, 1.311])
CB_cc = np.array([0.963, 0.975, 0.801, 0.814, 0.946, 0.984, 0.968, 0.647,
                0.832, 0.905, 0.751, 0.822, 0.932, 0.901, 0.868, 0.697])

#arrays to be passed to taylor_diagram
ratio = zeros((ncase, nvar))
cc = zeros((ncase, nvar))
ratio[0,:] = CA_ratio
ratio[1,:] = CB_ratio
cc[0,:] = CA_cc
cc[1,:] = CB_cc

#Plot
ax, gg = taylor_diagram(ratio, cc, colors=['r', 'b'], title='Taylor diagram')
ax.legend(gg, case, frameon=False, xshift=50)
models = None
i = 1
for v,s in zip(var, source):
    model = '%i - %s_%s' % (i, v, s)
    if models is None:
        models = model
    else:
        models = models + '\n' + model
    i += 1
ax.text(0.05, 0.5, models, fontsize=12)