MeteoInfo 3.7.0 was released (2023-9-3)
Support CMA Radar base standard data with ppi, cappi, cr and 3d grid interpolation
Add append, insert, delete functions
Add stack, column_stack, row_stack functions
Add hypot, s_, index_exp functions
Add amx, amin functions
Add mgrid, gradient functions
Add cond function in linalg package
Add Wedge patch
Add compare functions for DataFrame
Add view function for 3d axes
Add contour3 plot function
Add 2D streamplot function in 3D axes
support drawing contours along the surface of the volume data in contourslice function
Update FlatLaf to version 3.2
Update JOGL to version 2.5.0
Update proj4j to version 1.3.0
Some other bugs fixed
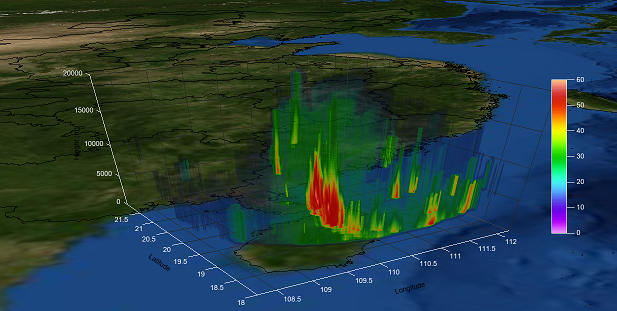
Read and plot 3D radar reflectivity data:
fn = r'D:\Temp\binary\radar\Z_RADR_I_Z9898_20190828181529_O_DOR_SAD_CAP_FMT.bin'
f = addfile(fn)
slat = f.attrvalue('StationLatitude')[0]
slon = f.attrvalue('StationLongitude')[0]
h = f.attrvalue('AntennaHeight')[0]
lon = arange(108.25, 112.25, 0.01)
lat = arange(18., 22., 0.01)
z = arange(1000, 20001, 500)

#Get 3d grid data
glon, glat = meshgrid(lon, lat)
x, y = RadarUtil.geographic_to_cartesian(slon, slat, glon, glat)
data = f.get_grid_3d_data('dBZ', x, y, z, h)

# Plot test
axes3d(orthographic=False, aspect='xy_equal', facecolor='k',
    fgcolor='w', axis=True, axes_zoom=True)
geoshow('world_topo.jpg')
geoshow('cn_province')
volumeplot(lon, lat, z, data, vmin=0, vmax=60, cmap='NCV_bright')
colorbar(shrink=0.8, tickcolor='w')
xlim(lon[0], lon[-1])
ylim(lat[0], lat[-1])
zlim(0, z[-1])
xlabel('Longitude')
ylabel('Latitude')
zlabel('Height (m)')