bar
scatter
Enter search terms or a module, class or function name.
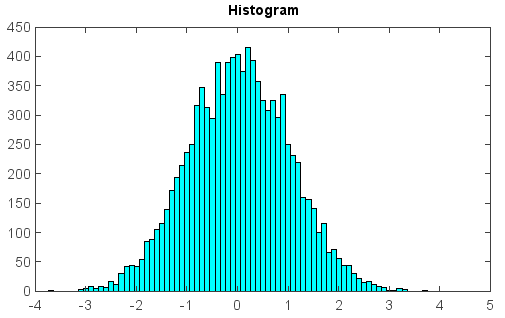
Plot a histogram.
Examples:
x = random.randn(10000)
hist(x, bins=50, color='c')
title('Histogram')