Polar plot
Polar axes can be created using axes(polar=True) function. Then use plot, bar and other plot
functions to plot the data in the polar axes.
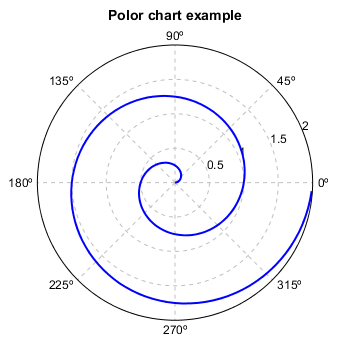
Plot a line in a polar axes
r = arange(0, 2, 0.01)
theta = 2 * pi * r

ax = axes(position=[0.1,0.1,0.8,0.8], polar=True)
plot(theta, r, color='b', linewidth=2)
title('Polor chart example')
antialias(True)
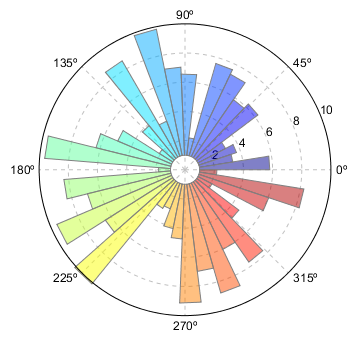
Plot bars in a polar axes
# Compute pie slices
N = 40
theta = linspace(0.0, 2 * pi, N, endpoint=False)
radii = 10 * random.rand(N)
cols = makecolors(N, alpha=0.5)

axes(polar=True)
bars = bar(theta, radii, theta[1]-theta[0], bottom=1, color=cols, edgecolor='gray')
antialias(True)